RESEARCH UNDERPINNING THE GRADE MODEL
The Impact of Government Revenue on the Achievement of the Sustainable Development Goals and the Amplification Potential of Good Governance
Highlights
This study models the relationship between government revenue per capita, quality of governance and the targets of several of the Sustainable Development Goals, including the coverage of the critical determinants of health; water, sanitation, healthcare, and education.
We used government revenue because the policies and practices of international and multinational organisations including corporations and banks – are more likely to influence revenue rather than government spending in countries in which they are engaged.
Significance of the Study
Increased government revenue is associated with increased progress towards the Sustainable Development Goals.
An improvement in the quality of governance amplifies this effect.
This modelling and its accompanying visualisations can predict the potential of an increase in government revenue in an individual country regarding progress towards the Sustainable Development Goals.
Research Approach
A standard linear model or a log-log model with constant elasticities would be inappropriate. Such a model would suggest achieving rates above 100% for a sufficiently high government revenue, which is unacceptable.
It is also probably true that at extremely low levels of income, an increase in government revenue would have a negligible effect.
We need a model with a broadly defined “S” shape that starts with minimal effects for very low levels of revenue and then has a period of rapid growth followed by a falling off as saturation is reached.
We, therefore, decided to adapt the basic logistic model by adding a set of exogenous variables to the function itself in the following way
SDGi = M/(1 + e−((α+χw)(x−(β+δw))))
where w is a k × 1 vector of exogenous variables, in our case, the indicators for governance and χ and δ are 1 × k vectors of parameters. This allows the shape of the logistic curve to vary for each country depending on the w vector.
We chose to focus on the six dimensions of governance from the World Governance Indicators and entered each of the six dimensions of governance into each equation as independent variables for our six SDG indicators, the dependent variables, and then move from this general specification to a simpler one by eliminating each variable that proved insignificant.
Study Results
Corruption seems to do the most work as it is significant in all models, followed by government effectiveness. The fact that some of the governance indicators are significant in every case demonstrates that the shape of the logistic curve does vary between countries substantially.
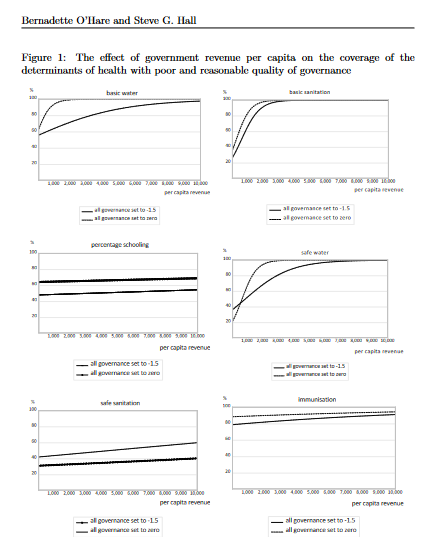
To help understand the relative importance of the governance and government revenue per capita, we conducted a simple set of experiments.We begin by setting all six dimensions of governance to -1.5 (we call this poor governance), which is representative of some of the countries. We estimate the long-run relationship between governance and the six SDG variables. We then reset all the governance indicators to zero, the mid-point of the range, (which we call reasonable governance) and again calculate the relationship between per capita government revenue and SDG variable, see figure 1.

Findings
We have modelled the impact of government revenue and governance on SDG 3, 4, and 6 variables at the individual country level. We found that increased government revenue is associated with progress towards the SDGs and this progress could be amplified considerably when there is improved governance.
The online visualisations of the models for individual countries offer the ability to realistically predict the impact of increases in government revenue, for example as a result of a reduction in debt service or an increase in the tax paid by large taxpayers such as multinational corporations. We expect this modelling to be of value to those who advocate for reduced corruption, reduced tax avoidance and debt service.

